How to Analyze Cash Flow Real Estate Investments + Attract Investor Clients
While homebuyers look for homes they can afford, real estate investors often look for properties with high cash flow potential.
In your local market, you’re likely to find great investment opportunities if you know where to look and what to look for. This article will share my strategy for analyzing cash flow real estate investment properties to help you find some gems near you. We’ll explain how to calculate net operating income, capitalization rate, return on investment, monthly cash flow, and more.
As a real estate agent looking to better serve your investor clients or simply looking for properties that would be ideal investment opportunities for yourself, you’ll need to learn how to find and analyze cash flow real estate investment opportunities. You never know when your current homebuyer client might evolve into tomorrow’s investor.
Over the years, I’ve come up with a simple formula to quantify the condition and risk assessment of cash flow properties. The formula will give you a numerical score for a property to help decide whether to invest. I’ve included it as a free download below:
Download My Property Condition Risk Assessment Worksheet
Research Rental Comps
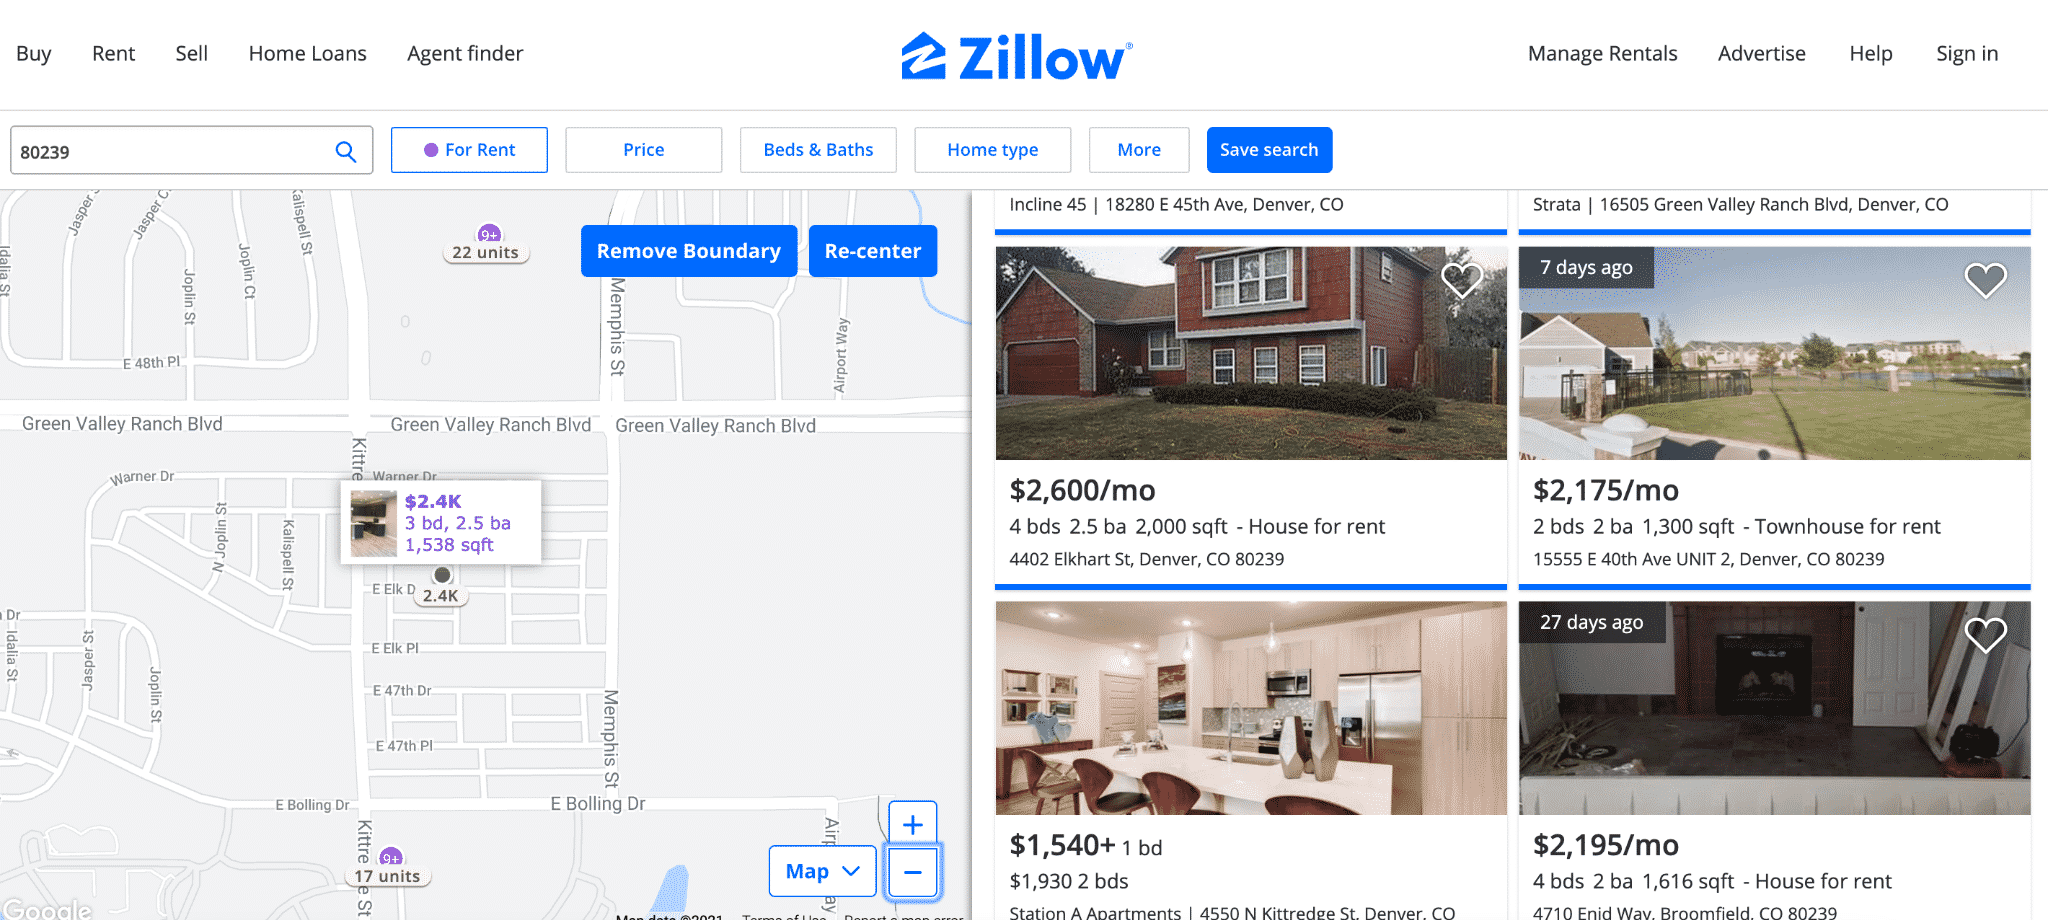
Before you start hunting for cash flow properties for your investor clients, you’ll need to have a deep understanding of your local rental market. Depending on the average age of homes in the area, I usually start by looking for comps of three-bedroom, two-bathroom, single-family homes that are 30 to 50 years old.
Most homes built from 1970 to 1990 have functional floor plans and two-car garages, especially compared to homes built pre-1970, which often have obsolete floor plans and require expensive electrical or plumbing overhauls. While newer homes usually sell for more money than older homes, they often yield significantly higher rents than properties of this vintage.
Whatever type of properties you are interested in, you can search for rental comps on websites like Craigslist, Zillow, and Rentometer. You’ll notice that rental rates vary significantly from one area to the next due to several factors, including the desirability of the location, age of the homes, nearby schools, number of bedrooms, and bathrooms.
On the microeconomic level, these factors impact what a given family is willing to pay in rent. Renters are generally seeking the same features that homeowners cherish, and these factors all affect rent rates and what a given market will bear.
Once you have determined the potential rental income of the property types you are interested in, you’ll want to compare them to the available homes for sale using the Rental Multiplier. It’s not a tech tool—just a simple math equation that’ll help you pinpoint properties with the potential for positive cash flow.
Narrow Your Search Using the Rental Multiplier

The Rental Multiplier helps you narrow your search. First, you’ll evaluate neighborhoods with higher rents. Then, you’ll use the Rental Multiplier to determine the maximum price your investor could pay for a home in a given area and still achieve a positive cash flow of $200 or more each month. The calculation is based on a traditional investor mortgage loan with a 20% down payment.
| Address | |||||
|---|---|---|---|---|---|
| 100 Main Street | |||||
| 555 Fifth Avenue |
The Rental Multiplier is a simple math equation that effectively reduces your focus to properties where the rents are higher than .75% of the sales price, OR the selling price is about the monthly rental rate times 130.
Take 100 Main Street in the table above as an example. If the average rental rate for a three-bedroom, two-bathroom home built in the 1980s is $2,000 per month, you’ll want to look for a home that’s priced close to $260,000 ($2,000 x 130 = $260,000).
Looked at another way, the home at 555 Fifth Avenue in the table above is priced at $234,000. The Rental Multiplier will give you a benchmark rental rate to make 555 Fifth Avenue a cash flow positive investment. Since .75% of $234,000 is $1,755, you’ll know that you can get a positive cash flow from purchasing 555 Fifth Avenue if you can reasonably rent the home for $1,755 per month.
The important thing is to use the Rental Multiplier to narrow your price range to only properties that are likely to achieve positive cash flow. For most areas, I use a maximum Rental Multiplier of 130, but the part of the country where you live and work may be more or less affordable.
If it’s more affordable, then your maximum Rental Multiplier may be lower than mine, whereas if your part of the country is more expensive, you may not easily find properties with a Rental Multiplier below 130.
Increase the Down Payment to Increase the Rental Multiplier Range
If finding properties with a Rental Multiplier below 130 is unachievable in your area, your real estate investor clients may need to put more money down to achieve the desired cash flow from a given property.
If you want to pinpoint neighborhoods that are ripe for investment, then check out my recent article: How Smart Investors Find the Best Places to Invest in Real Estate.
Look Outside Your Local Area
If you still can’t find properties in your area, even with a larger down payment, you might consider looking into other markets. There are many areas throughout the U.S. where you can still find properties below a Rental Multiplier of 130.
Americans now working from home are relocating to more suburban and rural areas, thereby expanding the number of opportunities for cash flow investing. If you’re serious about working with investors throughout the U.S., you might consider researching the reciprocity and portability laws in nearby states with better deals.
Real Estate License Reciprocity & Portability: A State-by-State Guide
Calculate the Capitalization Rate
Remember when you studied for your real estate license exam, and you thought, “When am I ever going to need this stuff?” Well, today is that day! The capitalization rate, or CAP rate, is another simple equation that you can use to determine the potential return on an investment property.
Investors also use a property’s CAP rate to compare similar properties throughout the U.S. without needing to know each property’s specific details. CAP rates are calculated based on the property’s income, expenses, and price, without regard to an individual investor’s down payment, loan terms, or financing.
CAP rates tend to be lower in areas where investor and buyer demand are high. Low CAP rates aren’t necessarily bad. Some areas with traditionally low CAP rates are more stable, meaning their property values are less impacted by recessionary times.
How to Calculate CAP Rate for Cash Flow Real Estate Invesments
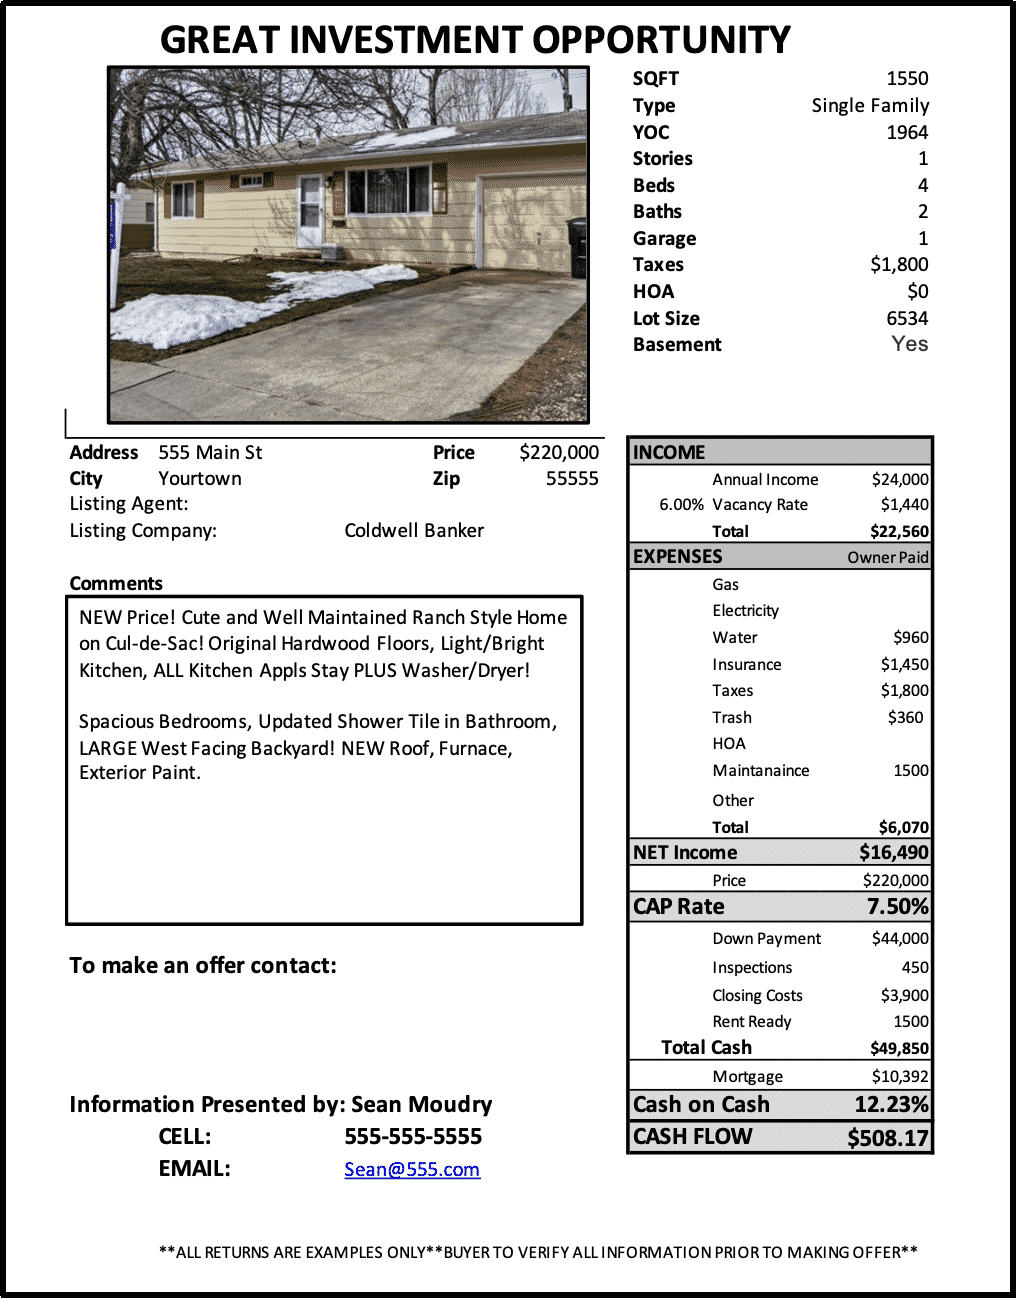
There are four easy steps to calculate a CAP rate. To make calculating CAP rate for your own properties easier, you can download my CAP rate worksheet for free below:
Download my CAP Rate Worksheet
1. Calculate the Gross Income
| Rent | |
| Vacancy Rate (6%) | |
| Additional Income | |
| GROSS ANNUAL INCOME | |
To calculate the CAP rate, you must first start with the gross income the property will generate in a year. Begin by adding together the monthly rental income. For example if the rental income is $2000 a month, the gross income would be $24,000 ($2,000 X 12 months = $24,000).
Vacancy Rate
Next, subtract the vacancy rate. Many MLS systems track vacancy rates. If this isn’t the case for you, ask a local property manager. In many areas today, an area’s average vacancy rate is below 3%, but in my experience, this isn’t realistically achievable.
If your property goes vacant once every two years and it takes you an additional month to clean it and get it rented to new tenants, then your home’s vacancy rate is actually 8% (2 months ÷ 24 months = 8.3%). For this reason, I typically use a vacancy rate of 6 to 8% to calculate a property’s CAP rate.
Additional Income
We do not have any additional expenses in this example. What constitutes additional income? Some small, multi-unit buildings generate income from on-site, coin-operated laundry, parking space fees, or even charge-backs for utilities. If the investment property you’re evaluating generates any income of this type, add it to the additional income section.
Calculating Gross Annual Income
After totaling the rental income and additional income, subtract any revenue lost due to vacancy to determine the property’s gross annual income. In this case, $24,000 in yearly rent less 6% due to vacancy, for a total of $22,560 in gross annual income.
Next, you must factor in expenses.
2. Add Together the Owner-paid Expenses
| Annual Property Taxes | |
| Gas/Propane | |
| Electricity | |
| Water/Sewer | |
| Trash Service | |
| Insurance | |
| Homeowners Association | |
| Property Management * | |
| Annual Maintenance (e.g., Landscaping, Heating and Air) | |
| Other | |
| GROSS ANNUAL EXPENSES | |
Next, to determine the property’s CAP rate, we need to calculate the Gross Annual Expenses.
Two types of expenses are related to investment property: those that the tenant pays and those that the owner pays. When calculating the CAP rate, we will only include expenses for which the owner is responsible. All expenses are calculated on an annual basis.
Do your best to gather costs directly from the source. Listing agents and sellers tend to underestimate or omit expenses. If you can’t get the expenses directly, ask the sellers to provide the last six months in bills.
I typically don’t include property management in my CAP rate calculations on single-family homes, condos, and small multi-unit buildings (like a duplex or four-plex) because I assume the investor will be managing the property themselves. For larger, multifamily properties, I include a 10% management fee.
3. Subtract Gross Annual Expenses to Get Net Operating Income
| Gross Annual Income | |
| Gross Annual Expenses | |
| NET OPERATING INCOME (NOI) | |
The Net Operating Income (NOI) is the income generated from the property after all the expenses are paid. It’s calculated by subtracting the Gross Annual Expenses from the Gross Annual Income ($22,560 – $6,070 = $16,490).
4. Calculate the CAP Rate
| Net Operating Income (NOI) | |
| Asking Price | |
| CAP RATE | |
The CAP rate is calculated by dividing the NOI by the property’s asking price. In the 100 Main Street example, the CAP rate is 7.49%. ($16,490 NOI ÷ $220,000 Asking Price = 7.5% CAP rate).
What Is a Good CAP Rate for Cash Flow Real Estate?
There isn’t a “good” or “bad” CAP rate because your investor’s target CAP rate entirely depends on their individual goals. A property with a higher CAP rate may have lower long-term appreciation than one with a lower CAP rate. However, unless your investor client is paying cash or putting a lot of money down, it isn’t easy to generate positive cash flow on a property with a CAP rate below 5%.
Calculate the Annual Cash-on-Cash Return

| Down Payment | $44,000 |
| Inspections | $450 |
| Closing Costs | $3,900 |
| Rent Ready Costs | $1,500 |
| Other | $0 |
| Total Out-of-Pocket Cash | $49,850 |
| Annual Cash Flow | $6,098 |
| ANNUAL CASH ON CASH RETURN (ROI) | 12.23% |
The cash-on-cash return or return on investment (ROI) shows what the potential annual return on your client’s cash investment could be. To calculate the ROI, you must include all the costs needed to acquire the property, including the down payment, loan closing costs, and inspection fees.
If there are expenditures needed to get the property rent ready (e.g., carpet, paint, and so on), then you should include those too.
Once you’ve totaled all out-of-pocket expenses, divide the property’s total annual cash flow ($6,098) by the total out-of-pocket expenses to purchase the property ($49,850). This will give you the annual rate of return you’re likely to achieve on investment in the property.
$6,098 Annual Cash Flow ÷ $49,850 Total Out-of-Pocket Cash = 12.23% Annual “Cash-on-Cash” Return or ROI
How to Calculate Monthly Cash Flow

| Net Operating Income (NOI) | $16,490 |
| Mortgage Payments (PI) | - $10,392 |
| Annual Cash Flow | $6,098 |
| Divide by 12 Months | ÷12 |
| MONTHLY CASH FLOW | $508 |
Monthly cash flow is the amount of money left over each month after all the expenses, mortgage principal, and interest payments are paid. Start with the NOI and subtract only the annual payment and interest (PI) payments on the mortgage. Next, divide it by 12 months to get the monthly cash flow.
In this example, we assume that the purchaser is financing $176,000 at 4.25% on a 30-year mortgage, with a monthly PI payment of $866. Not too shabby!
($16,490 NOI – $10,392 PI) ÷ 12 Months = $508 Monthly Cash Flow
This is an important step. Many larger multi-unit properties look like an outstanding deal until you factor in the financing. The reason is that some multi-unit buildings may require a commercial loan. Commercial financing typically demands higher down payments and offers higher interest rates than single-family financing.
Other Factors to Consider

CAP rate, cash flow, and ROI are great starting points to help you pinpoint outstanding investment properties for your clients. However, other financial considerations will come into play.
Owning real estate investment properties result in several tax advantages, including interest deductions and the ability to depreciate the building and improvements made to it. On the downside, beware that the IRS can recapture the depreciation and will tax any capital gains when the property is sold. Many investors choose to do a Section 1031 Exchange when they sell their properties.
Use the Financials to Negotiate Your Offer
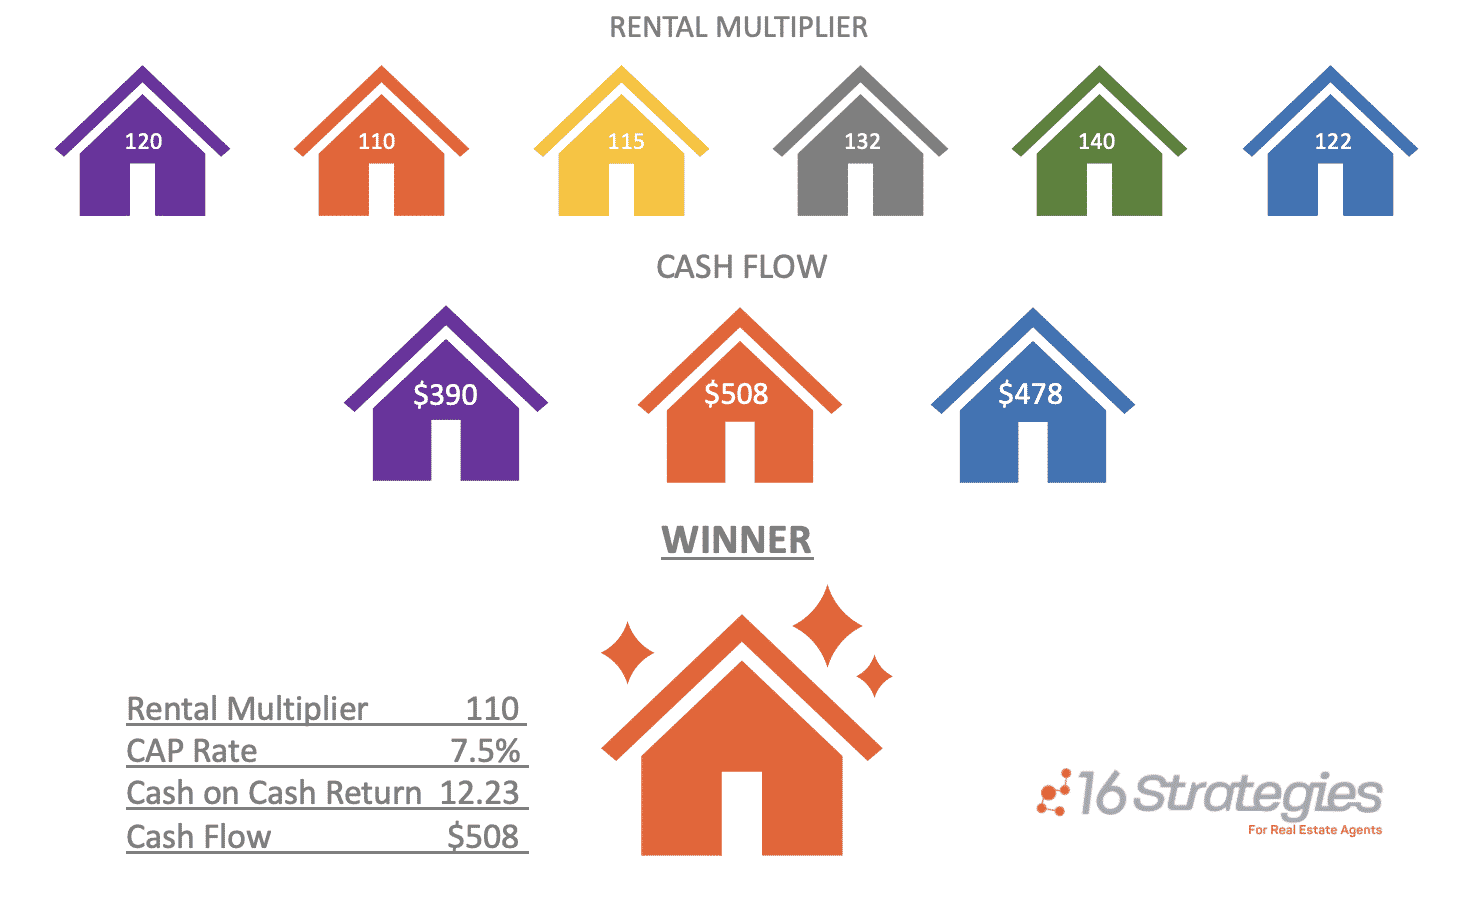
Use the Rental Multiplier to narrow your search to the six properties with the lowest Rental Multiplier. Next, pick your top three candidates and calculate the CAP rate, Return, and cash flow for each property.
Now you’re well-positioned to recommend the best cash flow investment property for your investor client. Use the financials to guide your client’s offer price. The right price doesn’t always mean a low offer. I’ve paid over the asking price when the financials described here made sense.
The Bottom Line
You attract bees with flowers, and you attract investors with cash flow real estate. Knowing how to find and analyze profitable cash flow investment properties is your first step to attracting investors and building another income stream in your real estate career.


Add comment